In dealership finance, PVR stands for profit per vehicle retail, the total F&I gross your store earns divided by the retail units it sold in a period.
A general finance reader might expect profit-volume ratio, but on the rooftop PVR is a dollar-per-car number that tracks back-end performance.
For a GM, F&I director, or dealer principal, PVR tells you how much the finance office produced on every car that rolled off the lot. It sits right next to retail unit count on the monthly operating review, and the big public groups report the same metric to investors. That is why the acronym carries real weight when front-end gross gets thin.
Before we get into benchmarks and levers, here is what separates a PVR number you can actually manage from one that just looks pretty on a recap:
In dealership finance, PVR means profit per vehicle retail. The formula every desk runs is simple: total F&I gross divided by retail units sold in the period. Some stores say PRU, per retail unit, but they are pointing at the same dollar-per-car result. That is the version a franchise operator hears when the word comes up in a save meeting or at month-end recap.
The denominator is where this metric earns or loses its credibility. A clean PVR counts every retail sale, not just the easy, financeable deals. A practitioner breakdown of the number warns against carving out older, high-mileage, lease, or fleet units to flatter the average. Pull the ugly deals out of the count and PVR climbs on paper while the store keeps the exact same gross. So the first thing a GM should check on the recap: is every retail unit actually in that denominator?
The accounting meaning is not wrong, it is just the wrong room. Outside auto retail, profit-volume ratio describes contribution divided by sales, usually shown as a percentage. It is a cost-accounting idea about how volume swings contribution margin. That percentage answers a different question than the dollar-per-car figure a dealer is managing. When your finance director and a controller from another industry both say PVR, they are not measuring the same thing. On the rooftop, the per-vehicle dollar is the one that drives pay plans and forecasts.
Everybody is watching F&I PVR more closely because the front end has thinned out and the back end is carrying the deal. StoneEagle's Q4 2025 data put average front-end gross at just $403 per unit, down from $561 a quarter earlier, while F&I PVR averaged $1,995 and total gross per deal landed at $2,397. By December, close to nine of every ten gross dollars on a deal came straight out of the finance office.
The public groups make it concrete. In Q1 2026 earnings reporting, AutoNation posted F&I PVR of $2,855, Asbury $2,302, Group 1 U.S. same-store $2,440, and Lithia $1,807, while StoneEagle's broader average sat near $1,986. That spread is the useful part, because it shows there is no single right number. Those figures come from large public retailers with scale and brand mix a single-point store may not share, so treat them as reference points, not a target your rooftop is failing to hit.
When fee income gets squeezed and front-end margin keeps compressing, PVR stops being an investor-table stat and turns into a store-level signal. That pressure pushes finance offices toward products customers actually value enough to keep, which is the same logic behind replacing vulnerable fees with tangible value.
PVR moves on a handful of levers, and each one pushes booked gross and retained gross differently. StoneEagle's Q4 2025 numbers show products per deal at 1.58, with VSC the volume anchor and the rest of the menu filling in around it. Here is how the levers actually behave on the deal:
The reserve and the cancellable products are exactly where booked PVR and retained PVR split apart. A deal can post strong gross and then lose it to a refund when the customer pays off early, refinances, or trades in. That is the moment the conversation shifts from selling more lines to keeping the gross already on the contract, and it is why a tighter menu often beats a crowded one. Our own take on building the right product mix for your store puts one non-cancellable theft-tech line alongside the VSC and GAP anchors for exactly that reason.
That is usually where Ikon enters the PVR conversation. Structured as a non-cancellable accessory, our installed program carries an average incremental PVR near $323 with $0 chargeback liability, so the gross it adds is gross the store actually keeps. The customer drives away with a tangible product on the car and in the app, not an invisible line item that gets unwound three months down the road.
Booked vs. retained PVR: Booked PVR is what the deal posts the day it funds. Retained PVR is what survives after refunds, early payoffs, and chargebacks. Cancellable products show the gap; non-cancellable hard-adds close it.
Review PVR by timing, manager, product category, and deal type, not as one blended month-end average. StoneEagle's 36-month analysis found the final three days of the month generated about 29% more new-vehicle finance deals per day, while average F&I PVR slipped from roughly $2,682 earlier in the month to $2,506 in that closing rush. The volume spike is real, and so is the per-deal softening that rides along with it.
Read the recap with that pattern in mind, then push past the average to the follow-up questions. How much of last month's PVR was still on the books 90 days later, and which products drove the cancellations? Pair the timing view with a hard look at how chargebacks erode retained gross, and the monthly number turns into something you can actually manage.
Once the acronym is settled, the real work moves from defining PVR to managing its quality. The same front-end compression that put the finance office at the center of the deal also makes every chargeback sting more. The store that wins is the one watching what it keeps, not just what it books.
Your next review should put three things on the desk together:
Start with the denominator, then trace the booked number through to what survived the quarter. That single habit tells you more about your finance office than any month-end average ever will.
Yes. In everyday dealership use, PVR and PRU point at the same thing: profit per vehicle retailed, or per retail unit. Both describe F&I gross divided by retail units sold. Operators flip between the two terms in save meetings and recaps without changing the math, so there is no reason to police the wording.
There is no single universal target. In Q1 2026, large public groups ran from Lithia's $1,807 to AutoNation's $2,855, with StoneEagle's broader average near $1,986. Treat those as reference points, not guarantees, since big public retailers carry scale and brand mix a single-point rooftop may not match.
Yes. A useful store metric counts every retail unit, cash deals included. The clean calculation resists pulling deals out of the denominator just because they are harder for the finance office. Excluding cash, lease, or high-mileage units inflates the average on paper while the store keeps the exact same gross.
Chargebacks attack retained PVR, the gross you actually keep after the deal funds. Cancellable products create refund exposure when a customer pays off early, refinances, or trades in, so booked PVR can look strong while retained PVR shrinks. Non-cancellable installed technology avoids that erosion, which is how Ikon protects gross already on the contract.
VSC and GAP do most of the heavy lifting, with Q4 2025 penetration at 45% and 39%, backed by ancillaries like paint-and-fabric at 20%, prepaid maintenance at 17%, and tire-and-wheel at 10%. Products per deal sat at 1.58. The goal is a tighter, higher-keep mix, not more menu clutter that invites cancellations.
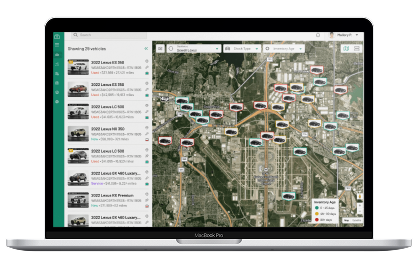
Master your lot. Locate cars and keys effortlessly to accelerate sales, check battery levels, run audit reports, view lot aging, all with no upfront device costs. We only make money when you do.
Ikon Lot Management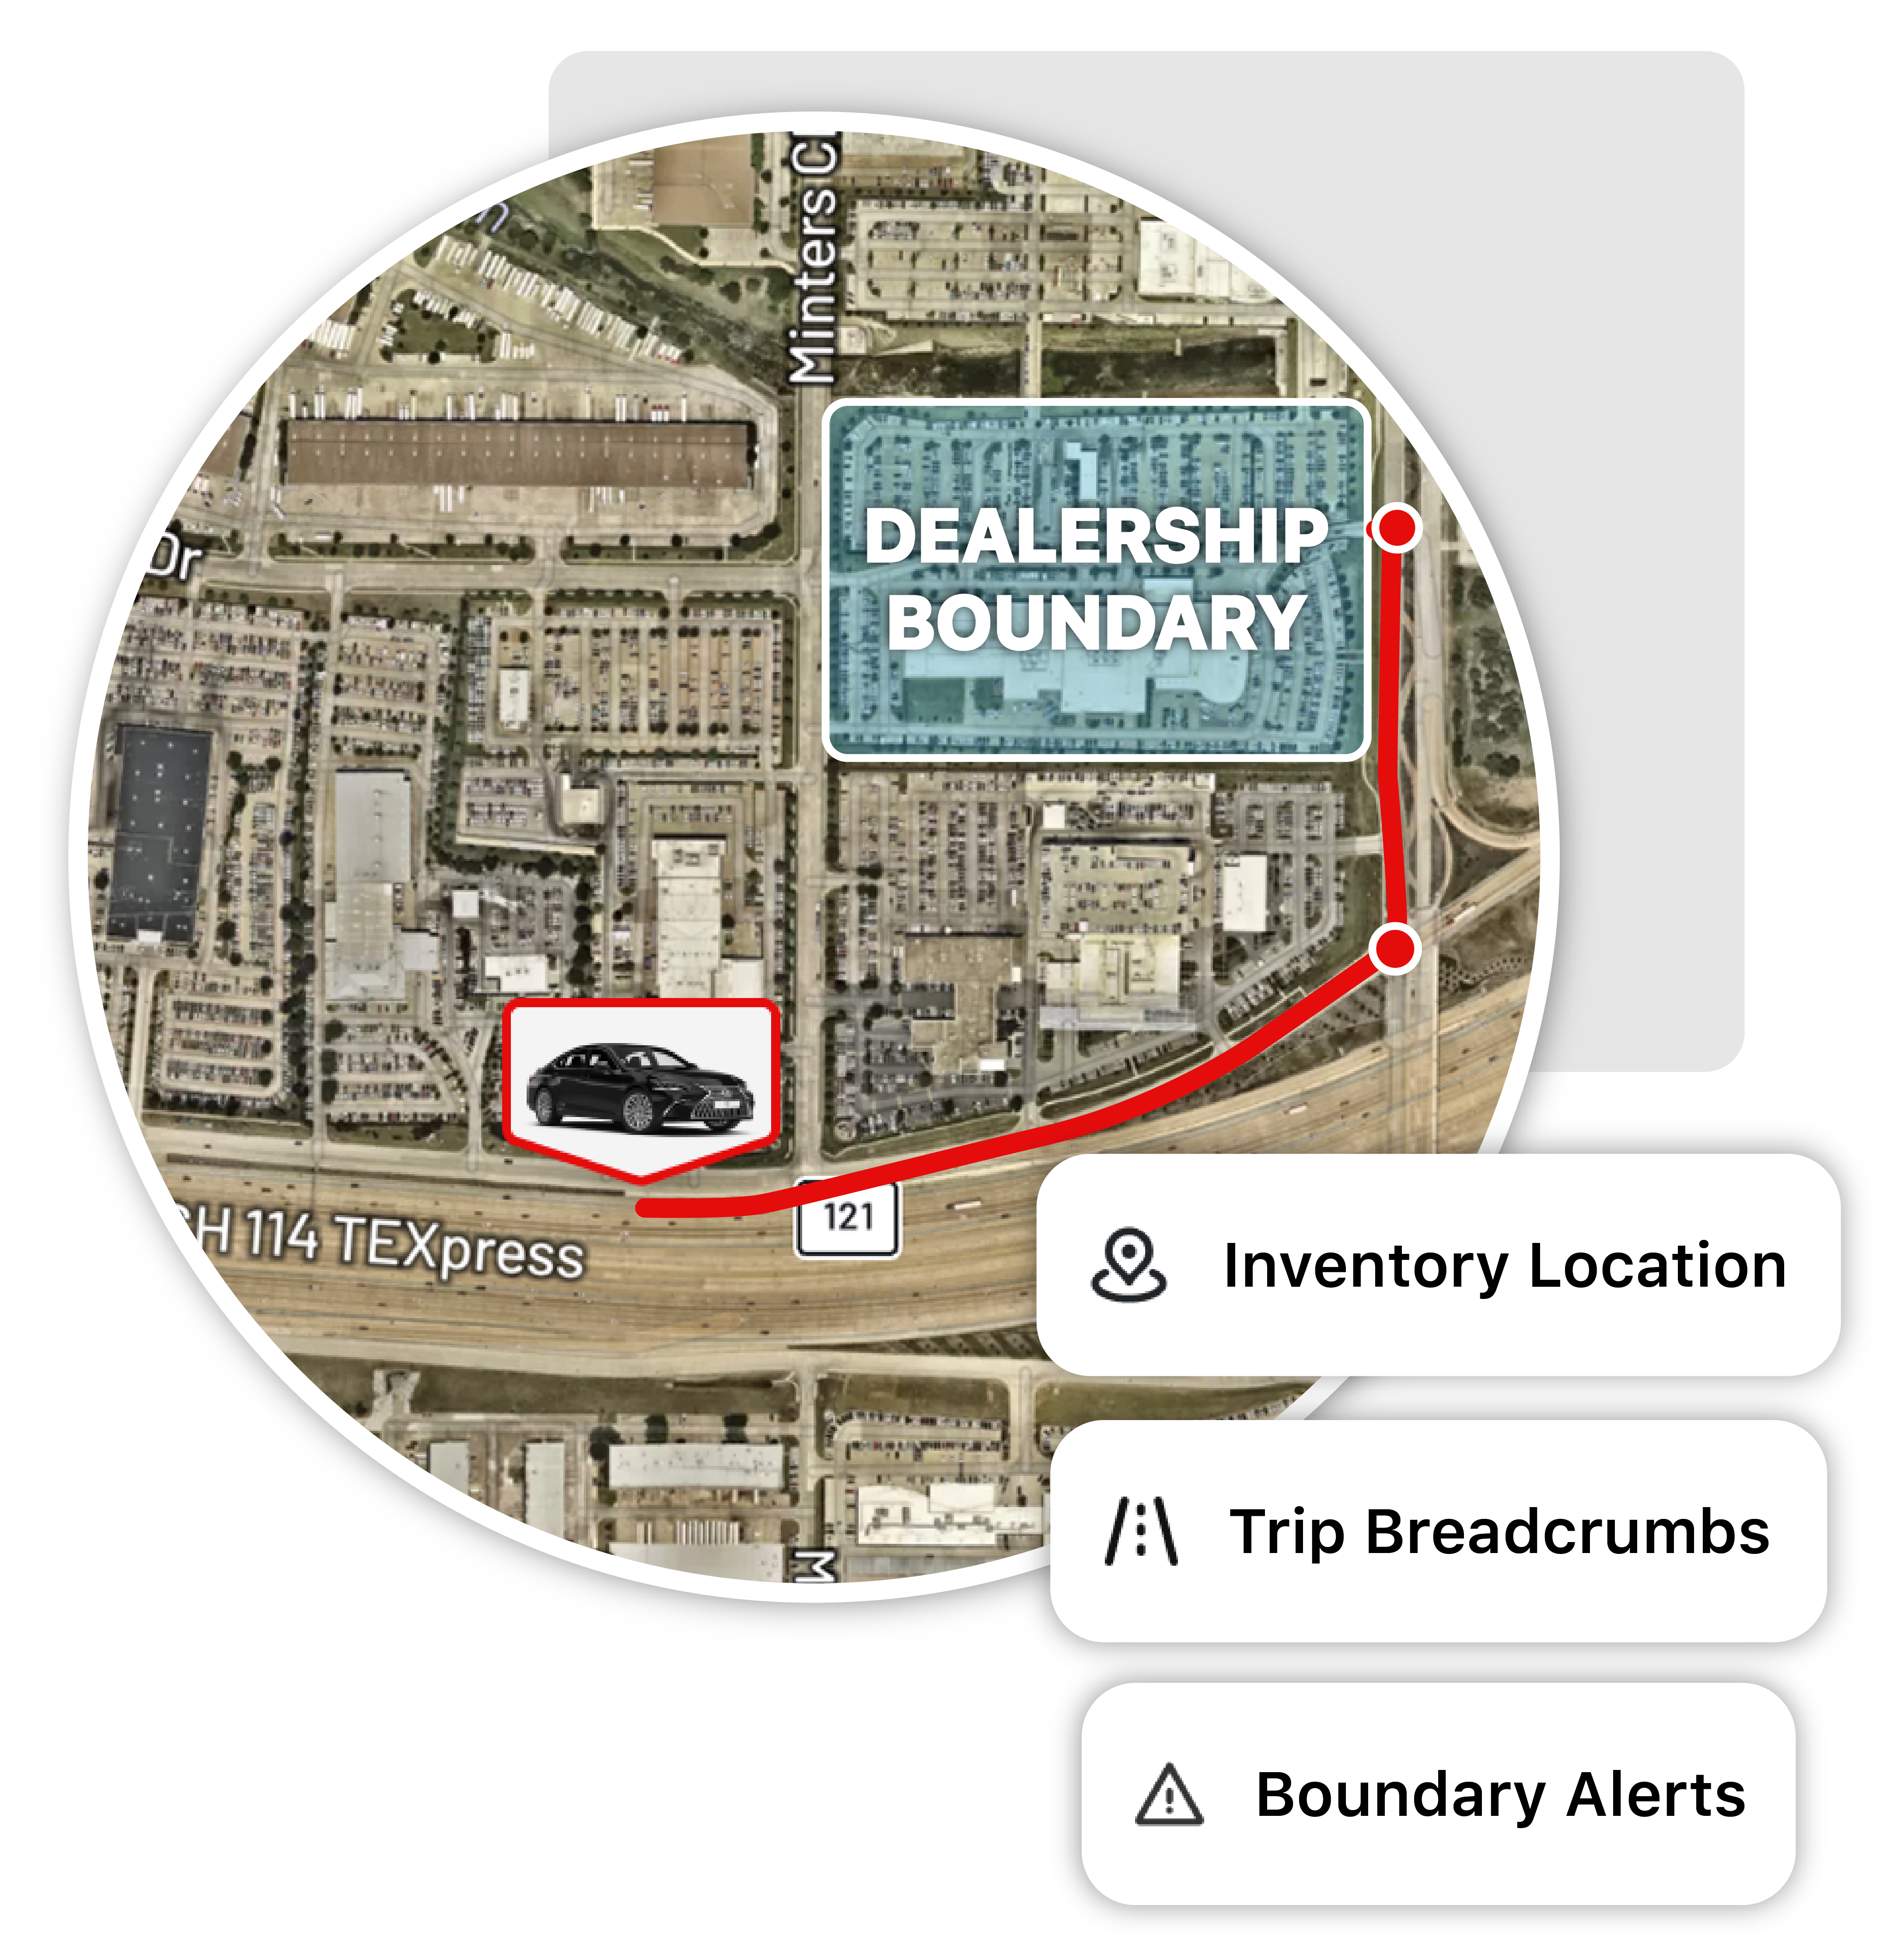
Stop inventory loss with near-real-time GPS tracking designed for rapid recovery. Ikon’s active theft recovery helps you secure your lot and lowers insurance premiums and deductibles.
Ikon Theft Recovery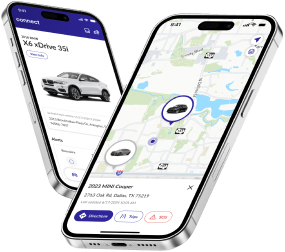
Get an avg. $323 PVR uplift by selling customers peace of mind and theft recovery featuring a $10,000 theft benefit. Your dealer-branded app keeps them connected to you, not the OEM.
Ikon Connected Car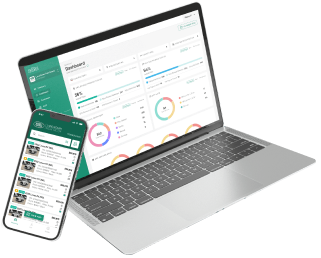
Maximize service retention and increase ROs with our mileage-triggered, automated text campaigns. We text customers at exactly the right time, driving them to your service scheduler.
Ikon Smart Marketing.jpg)





.jpg)